File:Overload.svg
From TheAnalogThing

Size of this PNG preview of this SVG file: 360 × 198 pixels. Other resolution: 320 × 176 pixels.
Original file (SVG file, nominally 360 × 198 pixels, file size: 41 KB)
Summary
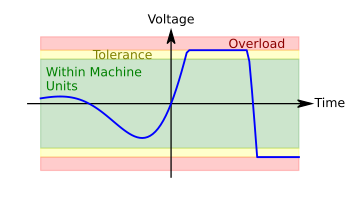
A cartoon displaying the Machine Units. Made by User:Sven
Python/Matplotlib source code
import pylab as pl, numpy as np

# some inspiration comes from https://stackoverflow.com/a/23855021

maxX = 5

A = 1.5 # sin amplitude
B = 1.2 # clipping
C = 1.0 # computing range

x = np.arange(-maxX, maxX,0.1)
y = np.exp(x/2) * np.sin(x)*A
tolerance = np.logical_or(y < -C, y > C)
overload = np.logical_or(y < -B, y > B)
y = np.clip(y, -B, B)

fig = pl.figure()
ax = fig.add_subplot(111)

ax.plot(x, y, color="blue")

a = 0.2
ax.fill_between(x,  B,  A, color="red", alpha=a)
ax.fill_between(x,  C,  B, color="yellow", alpha=a)
ax.fill_between(x, -C,  C, color="green", alpha=a)
ax.fill_between(x, -C, -B, color="yellow", alpha=a)
ax.fill_between(x, -A, -B, color="red", alpha=a)

ax.text(0, 1.8, "Voltage", ha="center")
ax.text(5.5, 0, "Time", va="center")

ax.text(-4.8, 0.3, "Within Machine\nUnits", color="green")
ax.text(-3, 1.0, "Tolerance", color="Olive")
ax.text(+2.2, 1.25, "Overload", color="Darkred")


xmin, xmax = ax.get_xlim()
ymin, ymax = ax.get_ylim()

# removing the default axis on all sides:
for side in ['bottom','right','top','left']:
    ax.spines[side].set_visible(False)

# removing the axis ticks
pl.xticks([]) # labels
pl.yticks([])
ax.xaxis.set_ticks_position('none') # tick markers
ax.yaxis.set_ticks_position('none')

# wider figure for demonstration
fig.set_size_inches(4,2.2)

# get width and height of axes object to compute
# matching arrowhead length and width
dps = fig.dpi_scale_trans.inverted()
bbox = ax.get_window_extent().transformed(dps)
width, height = bbox.width, bbox.height

# manual arrowhead width and length
hw = 1./20.*(ymax-ymin)
hl = 1./20.*(xmax-xmin)
lw = 1. # axis line width
ohg = 0.3 # arrow overhang

# compute matching arrowhead length and width
yhw = hw/(ymax-ymin)*(xmax-xmin)* height/width
yhl = hl/(xmax-xmin)*(ymax-ymin)* width/height

# draw x and y axis
ax.arrow(xmin, 0, xmax-xmin, 0., fc='k', ec='k', lw = lw,
         head_width=hw, head_length=hl, overhang = ohg,
         length_includes_head= True, clip_on = False)

ax.arrow(0, ymin, 0., ymax-ymin, fc='k', ec='k', lw = lw,
         head_width=yhw, head_length=yhl, overhang = ohg,
         length_includes_head= True, clip_on = False)

#ax.set_ylim(-maxX,maxX)

# clip_on = False if only positive x or y values.

pl.tight_layout() # get rid of too much whitespace

pl.savefig('overload.png', dpi = 300)
pl.savefig('overload.pdf')
pl.savefig('overload.svg')
Licensing
This file is licensed under the Creative Commons By-SA 4.0 License.
File history
Click on a date/time to view the file as it appeared at that time.
| Date/Time | Thumbnail | Dimensions | User | Comment | |
|---|---|---|---|---|---|
| current | 10:45, 9 August 2021 | | 360 × 198 (41 KB) | Sven (talk | contribs) | A cartoon displaying the Machine Units. Made by User:Sven == Python/Matplotlib source code == <pre> import pylab as pl, numpy as np # some inspiration comes from https://stackoverflow.com/a/23855021 maxX = 5 A = 1.5 # sin amplitude B = 1.2 # clipping C = 1.0 # computing range x = np.arange(-maxX, maxX,0.1) y = np.exp(x/2) * np.sin(x)*A tolerance = np.logical_or(y < -C, y > C) overload = np.logical_or(y < -B, y > B) y = np.clip(y, -B, B) fig = pl.figure() ax = fig.add_subplot(111... |
You cannot overwrite this file.
File usage
There are no pages that use this file.